
Early this February, a sudden and coordinated downturn hit the global financial markets, sending cryptocurrencies into a “flash crash” and causing significant ripples across traditional assets. While the crypto market saw double-digit percentage drops, the volatility extended to blue-chip stocks like Nvidia and Tesla, as well as safe havens like Gold and Silver.
1. The “February Correction” in Numbers
Past week (early February 2026) was characterized by a sharp deleveraging event. Total crypto market capitalization shed over $300 billion in a matter of days.
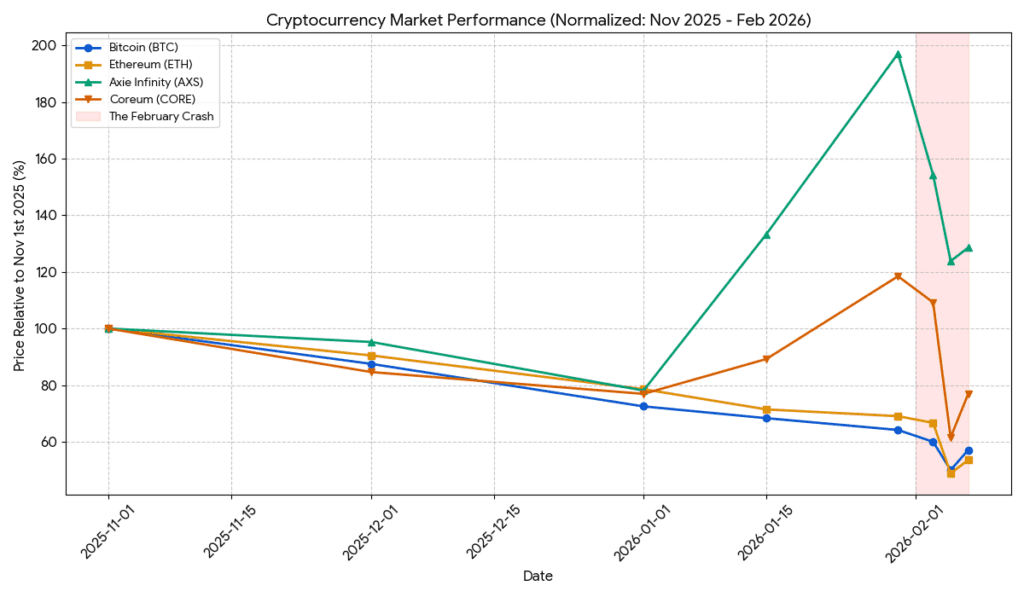
The chart uses normalized data (where November 1st, 2025 = 100%) to provide a clear comparison of the relative volatility and the magnitude of the recent February crash across different assets.
- Major Cryptocurrencies:
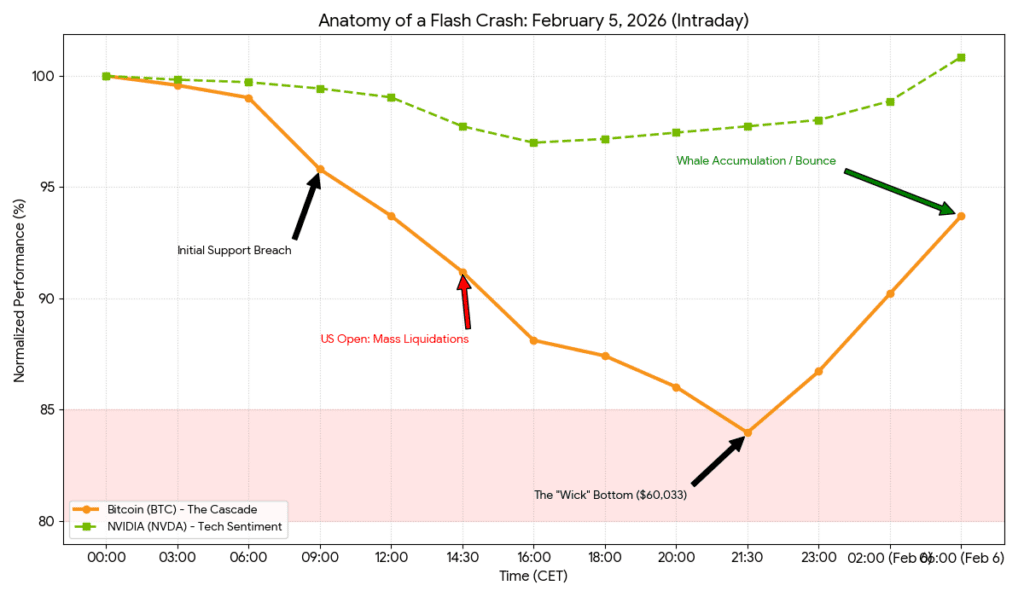
- Bitcoin (BTC): Slipped roughly 19% over the week, crashing from over $72,000 to a low of approximately $60,000. Analysts noted a significant “Coinbase Premium” flip, where BTC was trading cheaper on U.S. exchanges than offshore, signaling institutional selling.
- Ethereum (ETH): Followed Bitcoin’s lead with a 15-18% drop, struggling to maintain psychological support at the $2,800–$3,000 level.
- Ripple (XRP) & Solana (SOL): Both suffered heavy losses. Solana, often seen as a high-beta asset, dropped nearly 22% as speculative “meme-coin” liquidity evaporated.
- Stablecoins & Ecosystem Tokens:
- Tron (TRX): While TRX often acts as a stable hub for USDT transactions, it saw a 10% decline as users exited the ecosystem to secure liquidity.
- Coreum (CORE): This enterprise-grade layer-1 saw its ecosystem tokens drop by 15%, as risk-aversion hit niche infrastructure projects particularly hard.
- Axie Infinity (AXS): The gaming giant experienced a 28% weekly decline, bottoming near $1.81. Despite a “tokenomics overhaul” (introducing bAXS), it couldn’t escape the broader GameFi sell-off.
2. LEADS TO EXPLAIN THIS SUDDEN DROP
So far, analyst reports show that it’s most likely a hasardous aggregation of factors, forming a “perfect storm” of macroeconomic and geopolitical elements:
- The “Warsh Shock”: President Trump’s nomination of Kevin Warsh (30th of January 2026) as the next Fed Chair initially spooked markets. Despite Warsh’s reputation as a “responsible pair of hands,” the market interpreted the news as a signal that the era of “easy money” and Fed independence might face friction, causing Treasury yields to spike and the U.S. Dollar to strengthen.
- Deleveraging & Margin Calls: Bitcoin’s drop below $70,000 triggered a cascade of liquidations (05th of February 2026). Futures open interest plummeted from $61B to $49B in 48 hours as leveraged traders were forced out.
- Geopolitical Tensions: Heightened rhetoric between the U.S. and Iran in the Persian Gulf created a “risk-off” environment. Concerns over a potential military strike led to an immediate flight from risky assets into cash.
- AI Hype Exhaustion: There is growing skepticism regarding the immediate ROI of AI infrastructure. This hit Nvidia and Bitcoin miners (who had pivoted to AI hosting) simultaneously, as financing conditions tightened.
3. Impact on Major Market Values
The contagion was not limited to crypto; “Magnificent Seven” stocks and traditional hedges were also caught in the crossfire.
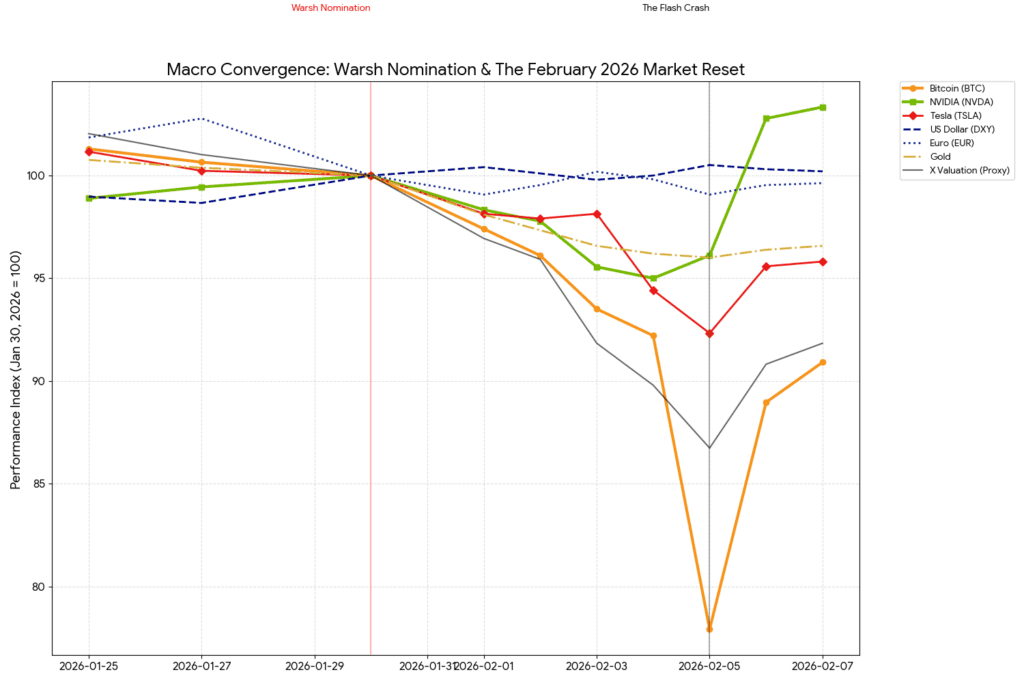
- Nvidia (NVDA): Saw a volatile week, dropping nearly 3% in a single Tuesday session as investors rotated out of tech. However, it staged a 7.9% recovery late in the week (Feb 7) after record capital expenditure reports from cloud providers, showing a decoupling from the crypto crash.
- Tesla (TSLA): Dropped roughly 2% during the height of the mid-week panic, weighed down by the same high-interest-rate fears that affected the tech sector.
- X (formerly Twitter): While not public, the “Trump-World” ecosystem saw volatility in sentiment-linked assets (like Truth Social’s DJT), which fluctuated based on the Fed nomination news.
- Gold & Silver: Surprisingly, these safe havens did not rise initially. Gold fell by 3.9% and Silver saw a spectacular collapse earlier in the cycle. This was due to the “strong dollar” effect—when the dollar surges due to rising interest rates, it makes gold more expensive for foreign buyers and less attractive than yield-bearing bonds.
4. WHAT COMES NEXT
We used Gemini to try to aggregate elements and provide us with an estimation / explanation of what could happen next. Here is what it has predicted.
| Term | Projection | Rationale (per VanEck, J.P. Morgan, & NYT) |
| Short Term (1-2 Weeks) | Volatile/Flat | The market is looking for a “bottom.” Until US-Iran tensions cool or the Fed’s path is clarified, “Extreme Fear” (8/100 on index) remains. |
| Medium Term (2026 Q1-Q2) | Moderate Recovery | Analysts expect a “clearing of the decks.” If Nvidia’s Feb 25 earnings are strong and the “Warsh Fed” signals rate cuts for later in the year, Bitcoin could retest $75,000. |
| Long Term (2026-2027) | Bullish | The “Halving Cycle” psychology persists. Sourced opinions from DL News suggest the four-year cycle remains intact, with potential new highs for BTC ($100k+) and Gold ($5k+) as inflation concerns return later in 2027. |
Sources: Le Monde (Global Macro Analysis), The New York Times (Fed Policy & Politics), The Guardian (Geopolitical Impact), VanEck Market Insights, J.P. Morgan Global Research.