After a carefull reading of the last CCI report for Guadeloupe, I wanted to experiment something: basing myself on publicly available data and using GenAI (Gemini 3.1 pro), would I be able to produce a report that would at least make as much sense and draw meaningful conclusions ?
Here is the result, I’ll let you judge.
Sources :
- Data-gouv: taxes level references
- IEDOM report for 2025
- IEDOM report for 2020
- IEDOM report for 2009
- IEDOM report for 2004
- Caricom report for 2021
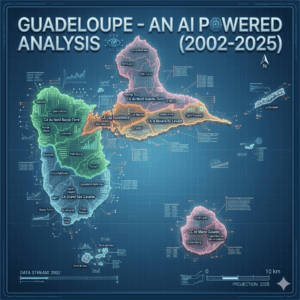
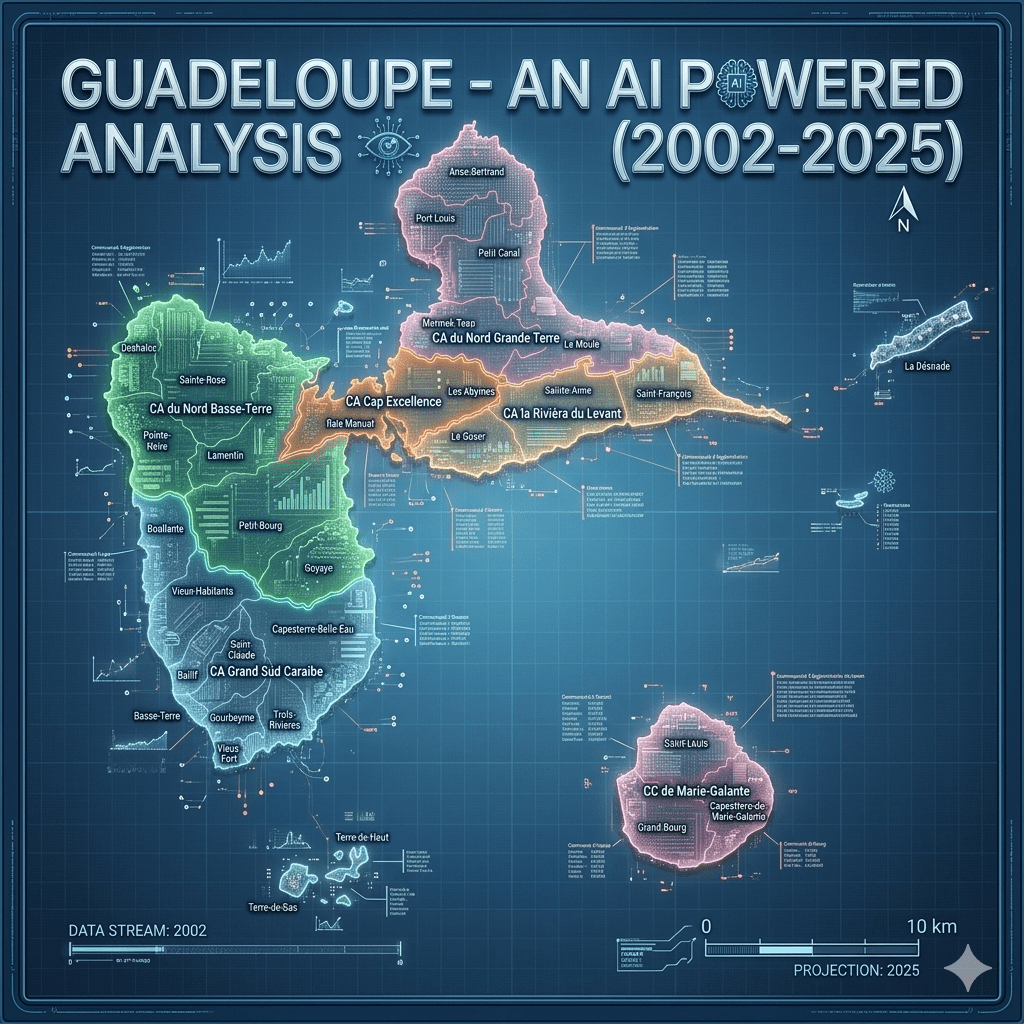
I – Overall wealth evolution analysis by city in Guadeloupe (2003 – 2025)
WEALTH INDICATOR: METHOD OF CALCULATION
To calculate a wealth indicator that strictly excludes retirees, we must pivot from the global “Impôt net” (which blends all demographics) and use the specific columns standing for active, non-retired households: “Nombre de foyers concernés” and “Montant” (which represents the total salary/wage income declared in K€).
By dividing the Total Amount (Montant) by the Number of Active Households, we get an Average Income per Active Household. This acts as a highly accurate wealth indicator for the working population of each city.
Here is the table calculating this indicator for every commune, sorted from the wealthiest to the least wealthy working populations.
Calculation: (Montant in K€ × 1000) / Nombre de foyers concernés = Average per Household in €City Wealth Indicator Evolution (Avg € per Active Household)
(Sorted by 2025 Rank)
| Rank | Commune | 2003 | 2010 | 2020 | 2025 | Total Evol. (22 Yrs) |
|---|---|---|---|---|---|---|
| 1 | Saint-Martin* | 14,725 € | 31,365 € | 23,866 € | 40,082 € | + 172.2% |
| 2 | Petit-Bourg | 24,706 € | 26,615 € | 34,725 € | 37,616 € | + 52.3% |
| 3 | Le Gosier | 23,619 € | 27,117 € | 28,195 € | 34,178 € | + 44.7% |
| 4 | Saint-Barthélemy* | 16,846 € | 23,054 € | 26,797 € | 34,037 € | + 102.0% |
| 5 | Vieux-Fort | 23,126 € | 23,478 € | 31,298 € | 33,670 € | + 45.6% |
| 6 | Baie-Mahault | 19,865 € | 30,896 € | 33,100 € | 33,430 € | + 68.3% |
| 7 | Goyave | 16,939 € | 23,146 € | 27,747 € | 30,286 € | + 78.8% |
| 8 | Saint-François | 19,161 € | 22,730 € | 25,925 € | 29,309 € | + 53.0% |
| 9 | Gourbeyre | 19,600 € | 22,087 € | 26,946 € | 29,178 € | + 48.9% |
| 10 | Le Moule | 17,157 € | 21,289 € | 25,598 € | 28,775 € | + 67.7% |
| 11 | Trois-Rivières | 18,602 € | 22,405 € | 26,734 € | 28,107 € | + 51.1% |
| 12 | Saint-Claude | 22,827 € | 26,591 € | 33,016 € | 27,593 € | + 20.9% |
| 13 | Sainte-Anne | 18,721 € | 21,743 € | 26,409 € | 27,504 € | + 46.9% |
| 14 | Anse-Bertrand | 15,004 € | 17,437 € | 25,046 € | 27,442 € | + 82.9% |
| 15 | Petit-Canal | 15,901 € | 20,057 € | 24,250 € | 27,195 € | + 71.0% |
| 16 | Morne-à-l’Eau | 17,017 € | 20,675 € | 24,092 € | 27,022 € | + 58.8% |
| 17 | Sainte-Rose | 17,150 € | 21,641 € | 24,939 € | 26,405 € | + 54.0% |
| 18 | Lamentin | 17,442 € | 24,065 € | 27,396 € | 26,252 € | + 50.5% |
| 19 | Terre-de-Haut | 13,346 € | 20,069 € | 20,031 € | 25,911 € | + 94.1% |
| 20 | Les Abymes | 14,704 € | 20,521 € | 22,942 € | 25,763 € | + 75.2% |
| 21 | Baillif | 16,393 € | 19,607 € | 22,746 € | 25,118 € | + 53.2% |
| 22 | Grand-Bourg | 13,326 € | 19,329 € | 22,393 € | 24,689 € | + 85.3% |
| 23 | Vieux-Habitants | 14,734 € | 18,664 € | 23,592 € | 24,568 € | + 66.7% |
| 24 | Pointe-Noire | 13,772 € | 18,981 € | 21,412 € | 24,498 € | + 77.9% |
| 25 | Bouillante | 14,279 € | 17,453 € | 21,119 € | 24,195 € | + 69.4% |
| 26 | Port-Louis | 15,420 € | 18,508 € | 21,486 € | 24,116 € | + 56.4% |
| 27 | Terre-de-Bas | 11,899 € | 18,004 € | N/A | 23,739 € | + 99.5% |
| 28 | Basse-Terre | 17,331 € | 19,733 € | 21,500 € | 23,694 € | + 36.7% |
| 29 | Capesterre-B-E | 15,102 € | 19,885 € | 22,730 € | 23,668 € | + 56.7% |
| 30 | Capesterre-MG | 13,722 € | 16,493 € | 20,611 € | 23,433 € | + 70.8% |
| 31 | Pointe-à-Pitre | 17,573 € | 20,148 € | 19,874 € | 22,226 € | + 26.5% |
| 32 | Deshaies | 16,275 € | 20,026 € | 22,248 € | 21,282 € | + 30.8% |
| 33 | Saint-Louis | 12,480 € | 16,120 € | 19,566 € | 20,863 € | + 67.2% |
(Note: St-Martin/St-Barth figures drop drastically in 2020 due to the combined lingering devastation of Hurricane Irma in 2017 and the 2020 Covid tourism shutdown, recovering strongly by 2025).
Analysis
Period 1 (2003–2010): The Era of the Economic Hubs
This period is characterized by explosive, concentrated wealth generation in specific zones, draining momentum from older establishments.
- The Rise of Jarry (Baie-Mahault): In 2003, Baie-Mahault (19,865 €) was actually less wealthy per active household than Petit-Bourg (24,706 €) and Saint-Claude (22,827 €). Between 2003 and 2010, Baie-Mahault experienced a massive +55.5% surge in average worker wealth. This perfectly mirrors the maturation of the Jarry industrial and commercial zone as the undisputed economic lung of Guadeloupe, attracting high-paying corporate and administrative jobs.
- The Northern Islands Boom: Saint-Martin (+113%) and Saint-Barthélemy (+36.9%) saw huge influxes of wealth. This maps perfectly onto their transition into Overseas Collectivities (COM) in 2007, which allowed them to adopt highly favorable fiscal statuses, attracting massive luxury tourism and high-net-worth investors.
- The Les Saintes Miracle: Both Terre-de-Haut (+50.4%) and Terre-de-Bas (+51.3%) saw massive jumps in worker income, likely tied to the modernization of their local tourism economies during this decade.
Period 2 (2010–2025): The Sprawl and Suburban Shift
In this second phase, the hubs that boomed in Period 1 maxed out, and wealth began spilling over into neighboring residential communes.
- The “Leapfrog” of Petit-Bourg: Because Baie-Mahault likely saturated its capacity for high-end residential real estate by 2010, the high-earners pushed south. Petit-Bourg, which stagnated in the 2000s (+7.7%), suddenly exploded in the 2010s (+41.3%), reclaiming its title as the wealthiest mainland commune in 2025.
- The Northern Grande-Terre Catch-up: Anse-Bertrand, which was largely left behind in the early 2000s, saw the highest mainland growth of the 2010-2025 period (+57.4%). This suggests a wave of gentrification, new residential development, or the rise of remote/independent high-earners moving away from the crowded center.
The 22-Year Losers: Structural Urban Decay
When evaluating the full 22-year span, an overall growth rate below 40% essentially means the commune’s workers lost purchasing power when accounting for two decades of inflation. The data reveals a harsh reality for Guadeloupe’s historical centers:
- Pointe-à-Pitre (+26.5% in 22 years): The historical and cultural capital of the island suffered catastrophic economic stagnation. Its active working class saw almost no real wage growth over two decades, confirming a total flight of the middle and upper classes to the Baie-Mahault/Petit-Bourg/Gosier triangle.
- Basse-Terre (+36.7%) and Saint-Claude (+20.9%): The administrative capital (Basse-Terre) and its historically aristocratic suburb (Saint-Claude) suffered the exact same fate. In 2003, Saint-Claude was the 3rd wealthiest mainland commune. By 2025, it had plummeted to 12th place, signaling a total shift of economic dynamism away from the “Côte-sous-le-vent” (West) toward Grande-Terre (East).
II – The Macro View – The Communautés d’Agglomération (EPCI)
The EPCIs, finalized right before 2015, faced their ultimate test in 2020. The numbers reveal how each region’s underlying economic model reacted to the shock.
Regional Wealth Indicator Evolution (Avg € per Active Household)
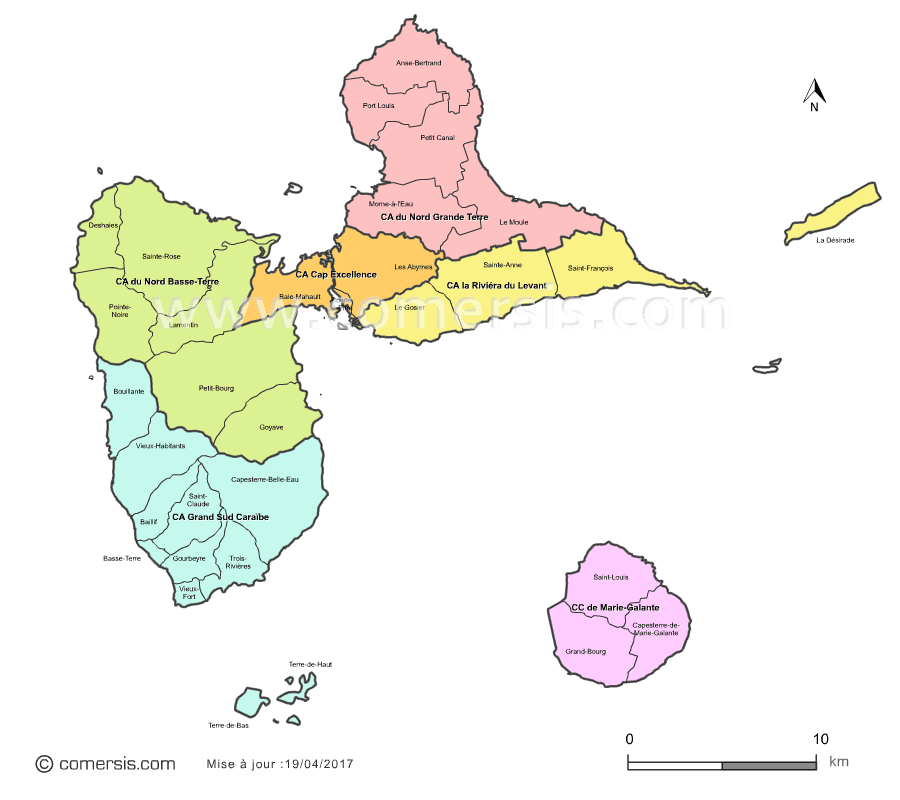
By grouping the communes into their respective Établissements Publics de Coopération Intercommunale (EPCI)—commonly known as Communautés d’Agglomération (CA) or Communautés de Communes (CC)—we can elevate the analysis from a micro (city) level to a macro-regional level.
Methodology Note: To calculate these numbers accurately, Gemini did not simply average the percentages. It aggregated the raw total wealth (Montant) and raw total active households (Nombre de foyers) for all the communes inside each CA, and then calculated the true weighted average income per active household. Saint-Martin and Saint-Barthélemy are excluded from this table, as they are separate collectivities and not part of Guadeloupe’s EPCI structure.
Here is the evolution of wealth by Agglomeration over the 22-year period.
| Rank | EPCI | 2003 | 2010 | 2020 | 2025 | Total Evol. |
|---|---|---|---|---|---|---|
| 1 | CARL (Riviera du Levant) | 21,323 € | 24,176 € | 26,909 € | 30,676 € | + 43.8% |
| 2 | CANBT (Nord Basse-Terre) | 19,316 € | 23,539 € | 28,586 € | 30,095 € | + 55.8% |
| 3 | Cap Excellence | 16,838 € | 23,596 € | 26,003 € | 27,899 € | + 65.6% |
| 4 | CANGT (Nord Grande-Terre) | 16,698 € | 20,372 € | 24,546 € | 27,506 € | + 64.7% |
| 5 | CAGSC (Grand Sud Caraïbe) | 17,244 € | 20,765 € | 25,078 € | 25,681 € | + 48.9% |
| 6 | CCMG (Marie-Galante) | 13,182 € | 17,863 € | 21,296 € | 23,466 € | + 78.0% |
Analysis: Did the EPCIs make it easier to live and work?
- The 2020 Resilience of CARL: Despite being the absolute epicenter of tourism (which legally shut down in 2020), CARL’s wealth actually increased to 26,909 €. This proves that by 2020, the local economy was saved by massive state transfers (Fonds de solidarité), allowing property owners to retain their wealth and prepare for the massive 2025 Airbnb/tourism rebound.
- The Cap Excellence Debt Bubble: By 2020, Cap Excellence hit 26,003 €. But as the 2025 report shows, corporate debt (from 2020 PGEs) skyrocketed. The CA failed to foster an ecosystem where small businesses could thrive natively without state life-support.
Conclusion on Axes 1 & 2: Over 22 years, it has become fundamentally harder to live for the average worker due to la vie chère, which survived the 2009 strikes, the 2020 pandemic, and the 2015 EPCI formations. Wealth is geographically locked in CANBT (residential real estate) and CARL (tourism real estate).
III – TO GO FURTHER: ALTERNATIVE PROPOSALS FOR 2035
If the EPCIs are to bring significant change and shield the population from the inflation and credit-dependency seen in the 2025 report, they must execute a radical shift toward local sovereignty and regional export.
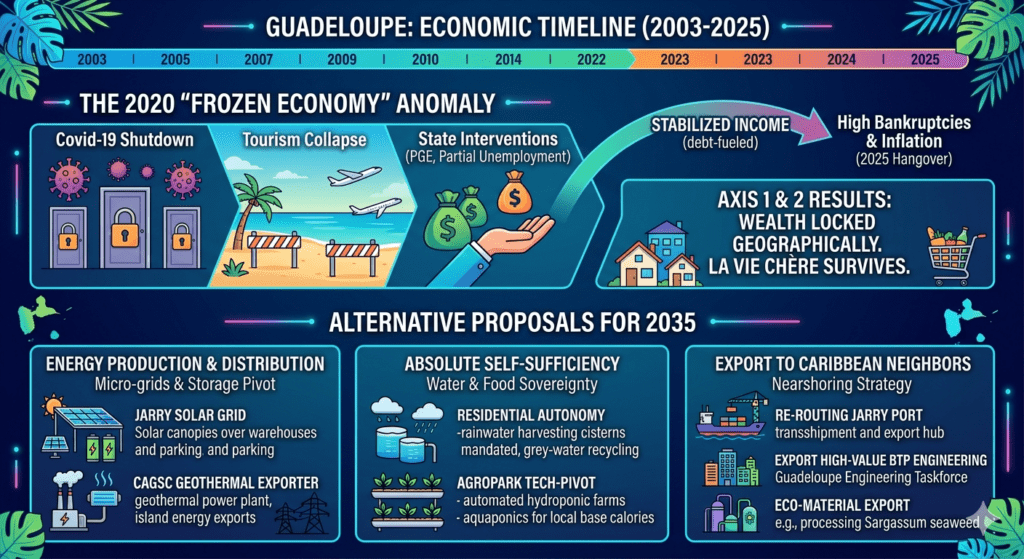
1. Energy Production & Distribution: The Micro-Grid and Storage Pivot
Guadeloupe’s inflation is highly correlated with imported fossil fuels (as noted in the 2025 CPI data). The current grid is centralized, vulnerable to hurricanes, and economically extractive.
- Agglomeration Micro-Grids: EPCIs like CANBT and Cap Excellence must bypass the traditional centralized utility model. Jarry should be transformed into a unified Solar Smart Grid. By mandating solar canopies over the thousands of square meters of parking lots and warehouses, Jarry can power its own corporate activities during the day, reducing operational costs for local businesses.
- Geothermal Expansion in CAGSC: The Grand Sud Caraïbe is dying economically, but it sits on the Bouillante geothermal resource. CAGSC must pivot its entire economic strategy to become the “Energy Exporter” of Guadeloupe, expanding geothermal production to sell stable, baseload electricity to the rest of the island, creating a new local engineering workforce to replace the dying BTP sector.
2. Absolute Self-Sufficiency (Water & Food)
The failure of the CAs to manage water led to the 320M€ “Plan Eau,” and the reliance on imported food requires the artificial “Bouclier Qualité-Prix”. These are not sustainable.
- Decentralized Water Sovereignty: Fixing underground pipes is a 20th-century solution. To adapt to the climate-induced droughts noted in the 2025 agricultural section, EPCIs must mandate Residential Autonomy. Any new construction permit in the booming CANBT or CARL zones must legally require 10,000-liter rainwater harvesting cisterns and grey-water recycling. The public grid should primarily serve high-density urban cores (Pointe-à-Pitre) and agriculture.
- The Agropark Tech-Pivot: Subsidizing the export of raw bananas to France makes no economic sense against Latin American competition. CANGT (Nord Grande-Terre) must use the upcoming 2026 Agropark to pivot exclusively toward import-substitution. Subsidies should fund automated hydroponic farms, aquaponics, and local food-processing facilities to produce base calories (poultry, vegetables, starches) directly for the local supermarket chains, permanently shattering the vie chère markup on imported food.
3. Export to Caribbean Neighbors: The “Nearshoring” Strategy
Guadeloupe suffers a 3.4 billion € trade deficit because it looks 7,000 km across the ocean to France, rather than 100 km to Antigua or Dominica.
- Re-routing the Port of Jarry: The 180M€ extension of the port must not be used to import more European cars (which now cost 27,000€, crushing household purchasing power). Cap Excellence must engineer Jarry as a Caribbean Transshipment and Export Hub.
- Exporting High-Value BTP & Engineering: The Guadeloupean BTP sector is collapsing locally (-9.8% revenue in 2025). However, Guadeloupe possesses world-class expertise in cyclonic and paraseismic engineering. The EPCIs and the Region should create a “Guadeloupe Engineering Export Taskforce,” financially backing local BTP firms to win infrastructure, port, and hospital construction contracts in neighboring OECS nations (Dominica, St. Lucia, Antigua).
- Eco-Material Export: Guadeloupe can process Caribbean nuisances into exports. For example, processing Sargassum seaweed into agricultural fertilizer or bioplastics, and exporting these eco-materials across the Caribbean basin. This creates an entirely new industrial sector independent of mainland France’s subsidies.
IV – CONFRONTING THESE AXIS WITH THE LAST CARICOM PUBLICATIONS
Integrating the macroeconomic environment of the wider Caribbean basin—guided by the strategic objectives outlined in the CARICOM reports and the region’s 2024-2025 trajectory—forces us to confront a profound paradox: Guadeloupe is geographically Caribbean, but economically European.
When we stress-test the previous alternative proposals against the reality of the Caribbean Single Market and Economy (CSME), the CARICOM “25% by 2025” food security initiative, and regional climate vulnerability, we must ask: Are our conclusions sustainable?
The answer is: Strategically yes, but institutionally highly constrained. The previous conclusions represent the only sustainable path forward, but they require Guadeloupe to break through the “glass wall” that separates it from its neighbors.
Here is the updated and augmented analysis, placing Guadeloupe’s 2025 EPCI (Communautés d’Agglomération) economy directly into the Caribbean theater.
1. Evaluating the “Nearshoring & Export Hub” Strategy
Previous Proposal: Use Jarry (Cap Excellence) to export Paraseismic BTP and Eco-materials to neighboring islands.
The Caribbean Reality (CARICOM Context):
While this proposal is strategically sound, exporting to CARICOM nations faces severe institutional friction. Guadeloupe is an Outermost Region of the European Union (RUP). It operates in Euros, pays European-level wages, and applies strict EU norms. Meanwhile, CARICOM operates largely in USD/local currencies and applies its own Common External Tariff (CET).
- The Threat: Guadeloupe’s BTP services are currently too expensive to compete with Chinese infrastructure firms heavily investing in the Caribbean, or even firms from Trinidad & Tobago.
- The Augmented Solution (High-Value Niche Diplomacy): To make the export strategy sustainable, Guadeloupe (via Cap Excellence and the Region) cannot compete on price; it must compete on standards and crisis response.
- CARICOM is uniquely vulnerable to climate change (hurricanes, earthquakes). Guadeloupe’s accession as an Associate Member of the OECS (Organization of Eastern Caribbean States) must be leveraged aggressively.
- Instead of exporting raw construction, Guadeloupe should export Engineering Consulting, Disaster Recovery Management, and European-certified Paraseismic architecture. The EPCIs should fund local BTP firms to partner with CDEMA (Caribbean Disaster Emergency Management Agency), making Guadeloupe the designated “rapid rebuild” hub for the Lesser Antilles after climate events.
2. Evaluating “Food Autonomy” vs. The CARICOM “25 by 2025” Vision
Previous Proposal: Pivot CANGT (Agropark) toward import substitution to end “La Vie Chère”.
The Caribbean Reality (CARICOM Context):
Our conclusion for Guadeloupe perfectly mirrors the existential panic of the entire Caribbean. CARICOM is currently executing its massive “25% by 2025” initiative—a unified mandate to reduce the region’s multi-billion-dollar extra-regional food import bill by 25% by the year 2025.
- The Threat: Currently, Guadeloupe imports European chickens and wheat, while neighboring islands import American products. There is virtually zero intra-regional agricultural trade due to strict European phytosanitary blockades (octroi de mer, EU customs).
- The Augmented Solution (Regional Agro-Processing Integration): Guadeloupe’s push for total self-sufficiency in isolation is mathematically unsustainable due to its limited landmass.
- The CANGT Agropark should not just aim for local autonomy; it should position itself as the Phytosanitary Bridge between CARICOM and the EU.
- Guadeloupe could import raw, bulk agricultural products from land-rich CARICOM nations (like Guyana or Belize), process them in the CANGT Agropark to EU standards, and supply both the local Guadeloupean market (lowering supermarket prices) and re-export them to Europe as high-value processed Caribbean goods.
3. Evaluating the “Energy Micro-Grid” Strategy
Previous Proposal: Expand Geothermal in CAGSC and Solar in Cap Excellence.
The Caribbean Reality (CARICOM Context):
The entire Caribbean is desperately trying to decouple from imported fossil fuels (which drain foreign currency reserves). However, Guadeloupe is not acting in a vacuum. Dominica is currently drilling its own major geothermal wells in the Roseau Valley, aiming to export power.
- The Threat: If CAGSC (Grand Sud Caraïbe) builds geothermal solely for itself, it misses economies of scale.
- The Augmented Solution (The Interconnected Grid): Energy sustainability in the Caribbean cannot be strictly localized. Guadeloupe must champion the long-discussed submarine electrical interconnection projects (like the Caribbean Geothermal network connecting Dominica, Guadeloupe, and Martinique). CAGSC’s Bouillante plant should act as the anchor for a regional micro-grid, allowing the French islands and the OECS to trade baseload electricity, permanently stabilizing energy inflation for the entire archipelago.
4. NEW AXIS: The Demographic & Labor Paradox
By looking at the CARICOM 2021/2024 reports, a glaring difference emerges regarding labor mobility. The CSME (Caribbean Single Market and Economy) allows the free movement of skilled nationals across member states.
- Guadeloupe’s Crisis: As noted in the 2025 IEDOM report, Guadeloupe suffers an aging demographic, a brain drain to mainland France, and a severe lack of skilled labor in BTP and health (45% of hires are deemed difficult).
- The Augmented Solution (Caribbean Talent Attraction): The Communautés d’Agglomération (like CARL and CANBT) are building wealth, but they are running out of working-age people to sustain the local economy. Guadeloupe must lobby Paris for differentiated Caribbean visa regimes. To save its BTP and healthcare sectors, Guadeloupe needs the legal flexibility to seamlessly hire English-speaking Caribbean nurses, engineers, and construction workers, integrating them into the local EPCI economies to replace the youth that have migrated to Europe.
FINAL SYNTHESIS: Is the Evolution of the EPCIs Sustainable?
When looking purely at the internal numbers from 2003 to 2025, the Communautés d’Agglomération like CANBT and CARL appear to have succeeded by building comfortable, credit-fueled residential wealth.
However, when placed in the Caribbean context of 2024-2025, this internal wealth is highly fragile and ultimately unsustainable.
- It is an artificial bubble: The wealth of Petit-Bourg or Le Gosier is heavily reliant on EU/French public transfers, high salaries from mainland administration, and European tourism. It is completely disconnected from the geographic reality of the Caribbean Sea.
- The Geography of the Future: The CARICOM reports make it clear that the future of the Caribbean belongs to those who integrate, trade locally, and pool resources against climate and inflation shocks.
Conclusion for 2035
The EPCIs of Guadeloupe must stop looking exclusively North to Paris and start looking East to the Caribbean. The only way the wealth generated in Cap Excellence or CANBT can become truly sustainable is if Guadeloupe uses its European standard of infrastructure to become the Premium Service, Healthcare, and Disaster-Resilience Hub for the Organization of Eastern Caribbean States.
If Guadeloupe remains a closed, importing European outpost in a Caribbean sea, la vie chère will eventually erode the wealth of even its most affluent cities.